New MusicVISTA Enhancement: Song Distribution Analysis
This analysis will be included in MusicVISTA as part of all future auditorium music tests:
You are now able to see how the songs you tested are distributed. Using filters that you select, the possibilities are nearly endless. You’ll be able to see, for example, whether your rules regarding things like era, tempo and sound code make sense. If your top testing songs are 30% from the 1970s, you can plan your clocks to match. If your Powers are 40% tempo 1, you’re not going to help Selector work well if you demand an average tempo of 3. Every aspect of balancing your categories and clocks can be improved by the new distribution information analysis now built into MusicVISTA.
I added a new item to the Reports menu: Song Distribution Report
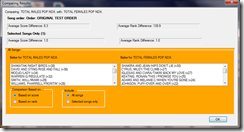
When you choose it, this window pops up:

All the filters you’ve created appear in the list on the left. In this case, all the filters are for Eras. But of course, many kinds of filter can be defined.
When you click on the name of a filter, it is added to the list on the right, and will be used in the analysis. If you make a mistake, you can click on a selected filter to remove it.
After adding a set of filters and clicking the Display distribution of songs button, the screen looks like this:

The number and percentage of songs matching each filter is displayed.
There are three distributions shown:
1. For all songs
2. For the top 200 songs, based on how the test is currently sorted. As you can see, the above test is sorted by: TOTAL SAMPLE/AVERAGE in descending order.
3. For the Selected songs. Songs may be selected by clicking and dragging the mouse over a range of titles, or by passing filters. So (for example) you can filter to only songs in Category A, and the Selected column will show how the songs distribute by Era within the A category. Very flexible!
Clipboard support:
· If you click on a column, the count and percent from each row of the results is formatted for a spreadsheet and placed on the Windows clipboard. The count and percent will paste beside each other into two columns of your spreadsheet.
· If you click on the first column, the filter names (in this case the Eras) will be copied to the Windows clipboard so you can paste them into a spreadsheet.
· The heading information is not copied.
Other features:
· This screen remains available as long as you run the program. Once you select a set of filters, they will remain selected.
· If you resort the songs, say by clicking on a different column of scores, or even some other column like FIT RANK, the Top 200 column will instantly update to match.
· If you change which songs are Selected, the Selected column will instantly update to match.
· Filters may overlap.


