Friday, December 30, 2011

What happens when the spots come on?

That’s the title of a study done by Media Monitors, Arbitron and Coleman Insights. It is an impressive effort. You can download a copy here:

What Happens When the Spots Come On- 2011 Edition – Arbitron

I was at the Arbitron Client Conference for the presentation. Overall, the news is good for radio.

It is good in this sense: The number of listeners that advertisers get is similar to the numbers in the ratings. At least within the PPM world. About 93% of them, in fact. So advertisers can rest a little easier. They are pretty much getting what they pay for.

Better for talk

It is a little misleading, in that the numbers look much better for spoken word formats than for music formats. For music stations, the number is about 88%. And for music listeners who are 18-34, it is about 85%.

So do we owe the advertisers a 15% discount? Hardly. People have always been able to tune away from commercials, including TV. They can choose not to read an ad in a newspaper or magazine.

Not so Useful for Programmers

As a programmer rather than a salesperson, this study is not as useful to me. It does not measure “retention”. How many of the people listening when the commercial break begins are still there after one minute, two minutes, etc.?

For advertisers, exactly which bodies are there isn’t as critical. But for programmers it is. We want to know how many are so irritated that they leave. Because new people are always joining the station (even during commercials!) we can’t see that information. In this study we see only the net effect of leaving and joining. And we certainly don’t find in this study the answer to the question “How long a break can I get away with?”

Not Everything is Measured by This

Minute-by-minute tune-in and tune-out numbers are interesting. But they fail to answer the most interesting questions.

How many people are irritated, but too busy with their lives to go “mess with” the radio? How many simply mumble something to themselves like “I need an iPod?”

How much damage is done to our brand? If they think you’re playing too many commercials, stopping the music for too long, stopping the music too often, etc. then you are. Advice: Ask your listeners.

Your brand is the experience your listeners believe you give them.

My View

I think long breaks are dreadful. They degrade the experience of listening to a music station. Don’t they for you? 

I think I know how long our breaks should be. But that’s a topic for another day.

This study could be a good start. It focuses our attention on this area and has rekindled debate. I hope you’ll join that debate.

And the raw data is there. Some of our programming questions could be answered. Let’s hope that by the end of 2012 we know a lot more about how to best handle our music flow.

Friday, September 23, 2011

Live from Las Vegas!

Finally underway!

Night one of two: The iHeartRadio Music Festival!

Here are some pictures I’m snapping as I watch…

IMG_0176IMG_0210

Earlier in the afternoon, it was about an hour wait on line for tickets. Listeners from all over the country, as far as the eye could see. There was plenty of line in front of me too!

IMG_0175

Black Eyes Peas kicked it off…

Saturday, April 30, 2011

Radio’s Bright Future

Recently Bob Pittman delivered a truly inspirational talk at the Ad Age Digital Conference.

A number of others have posted the link. But I’ve got to join in, just in case you haven’t watched this yet.

It will make you feel optimism for the future of our business!

http://www.livestream.com/adage/video?clipId=pla_b866fba4-55e5-4d23-a31c-ecc2d4a435fd

Monday, March 21, 2011

Are We Paying Attention to the Latest Research About PPM? Are You?

Noise in the system

I think we have to be a little bit careful when we apply PPM to programming, don’t you?

Coleman Insights did a study of former PPM respondents. The people didn’t choose to listen to those extra stations and they could not remember listening to them, nor could they say anything at all about the programming.

Arbitron and others have recently given us some great research. Listening occasions last an average of about 10 minutes. Clearly, those insanely long commercial breaks don’t work.

But is anybody paying attention?

And consider that clustering of commercials into just 2 (occasionally 3) breaks per hour. Notice also that even with the clear evidence that those long commercial breaks have not increased average listen length, nobody has gone back to the short breaks that good research has always told us listeners prefer.

And what about our customers?

Even if it is all the same to listeners (t isn’t) surely we would be doing a better job for advertisers if we didn’t bury their message in a sequence of 10 other commercials.

That obviously hurts the advertiser. Just the opposite idea of “we’re professionals, here to help you be successful”. But this is just what you would expect when the core competency of today’s radio executive is cost reduction and short term profits, versus building a brand.

Cume or engagement?

Maybe that extra listening to P4 – P8 stations that the PPM respondents can’t remember anything about still has validity to advertisers. But I doubt it. Today, there is a lot of recognition that you need engagement and connection if you’re going to end up with a new customer. Radio seems to be selling our reach. And inflating it at that. No engagement.

What do you think? Am I needlessly concerned? Or could we do a lot more, even when it comes to the basic lessons of the latest PPM research?

Tuesday, January 18, 2011

MusicVISTA Enhancement: Profile Your Key Artists to Learn Their Strengths

As I mentioned in the December newsletter, we are implementing a large number of fantastic new features in MusicVISTA, which already defines the leading edge of music research analysis.

Here is a brief summary of the latest enhancement!

Understand Artists Era Distribution and Strength

One of the important things we must think about when implementing an AMT is how we manage popular artists. How do we distribute them among categories? How do we avoid artist conflicts that make scheduling more difficult?

This new report will give you another tool for understanding who your most important artists are and how to deal with them.

Select Artist and Song Distribution Detail from the Report menu. The name has been changed to reflect the new ability to show the distribution for only a single artist.

clip_image001

The report will allow you to look at the distribution of songs among any selected group of the filters you have set up. It is common for programmers to set up Eras, and see how songs distribute among them. In particular, how does the distribution of the hits (top 100, top 200) compare to the overall distribution? Note that you can also highlight any group of songs. Their distribution will appear in the right-most column. So you can easily look at the top 50, for example.

In the example below, we are looking at Eras. But of course we can show how songs distribute among any set of filters we want. If you’re tracking tempo, sound codes, genres or anything else that can be measured for a song, it can be used as a basis to compare songs.

Below, we see that songs from the 1960s and 1970s have a stronger than average presence in the top 100 while songs form the 1980s are weaker than average.

clip_image003

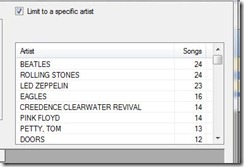
To use the new ability to work with individual artists, simply check the box: Limit to a specific artist

clip_image004

A list of every artist in the AMT appears. Initially displayed alphabetically, you can resort the list in order by number of songs in the test, as was done in the example above. Simply click on the column heading to change the sort order.

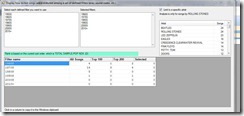
Click on the name of an artist to view how their songs are distributed by Era or other set of filters. In the example below, we look the Rolling Stones.

clip_image005

Particularly when working with all songs, some programmers like to paste the distribution information into Excel for further work, or into a word processing program for notes or a report. We make it easy, with one click to copy the results you want to the Windows clipboard. In the example below, we are using 5 year age breaks. How you set up era filters is entirely under your control.

clip_image006

A number of the most recent enhancements to MusicVISTA, like this one, are designed to make it easier to access information about your artists, see which ones are most important, and give you the information you need to properly manage them. You’ll be better able to avoid artist conflicts in scheduling, and balance them across categories. More to come. Guaranteed.

Monday, January 10, 2011

MusicVISTA Gets a New Report: Opinion Distribution

OpinionsDistributionReport

Click for full size.

Just when you might have thought there couldn’t be any more ways that MusicVISTA could slice and dice your music test, here is another report.

Purpose

There are many reasons you might want to see how the opinions from an AMT are distributed.

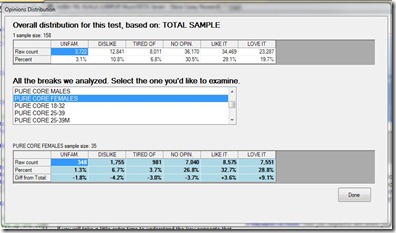
For example, you see lower scores than normal. Are Favorites down? Did you get a lot of “No Opinion” responses? Is the number of “Tired Of” responses up significantly?

What about different groups (which we call “breaks”? How do Pure Core format fans compare to the Total Sample? What about your competitor’s 18-24 Males?

Using the Report

The report always shows the distribution for the Total Sample. Below, you can select any of the AMTs sub-groups. The distribution of opinions for the selected break is shown, along with the difference between this opinion’s percent for this break compared to  the Total Sample.

Tuesday, January 04, 2011

Moving Music Research Software Into 2011

I’m staring at a long list of things I hope to accomplish in 2011. All of them are connected to making music research a more powerful and accurate tool for program directors around the world.

New Year, New Foundation

First step taken: I have moved the MusicVISTA software to a new version: Windows Seven and have set it up within Microsoft’s powerful Visual Studio 2010 development system.

That needs a brief explanation. Modern software does so much now, with all the visual elements, communications and multimedia, etc. that without some help, it would be impossible for mere humans to write computer programs.

Fortunately, huge and powerful systems have been invented to help. For Apple, the set of tools most often used is called XCode. For Microsoft it is Visual Studio. In addition, Microsoft provides a powerful version of the been-around-forever Basic language. It is called Visual Basic.Net. An example of the power: You can draw a picture of a Web browser and, yes, you now have a real Web browser waiting for the address of the page you want to display.

VB.Net is so easy to use that even I can write powerful software like MusicVISTA. You can too. There is even a free version that is far more powerful than you’d expect.

But MusicVISTA was first created about 5 years ago (as an update to the old Variety Control/MusicVUE package. Reflect on how much computers, including Windows, have changed during the past few years. With all the major updates we plan, we need the latest tools, completely compatible with Windows 7. Hence the update.

Already Making Improvements

The second step, and the first move to leverage the VS2010 environment, was to rebuild our way of playing music hooks. MusicVISTA has for some time been able to play back hook files. You can play one hook, all the hooks that define a music cluster center, or a group of hooks selected from the results display.

For those who use this feature: We are now building custom Windows Media Player playlists with the hooks we want to play and then allowing WMP to use a playlist in a single command . The advantage is that we can now stop and start the play of the hook or hooks in a smooth manner, even if you want to interrupt a hook while it plays. Technically, it was difficult. Today, it was easy.

Alternate to Hook Files

If you don’t supply hook files, remember you can always launch the song’s YouTube video instead. The advantage of the hook is the ability to hear what the respondents heard. You might decide that a given hook was not the best representation of the song. That could in some cases explain a low score or high unfamiliarity.

I like the video link. Working in so many countries and formats, I always review the top testing and most centered songs. That helps keep me up to date on the music that matters most.

Tuesday, September 07, 2010

New MusicVISTA Tool: Click for Music Videos

MusicVISTA continues to provide more information at your fingertips.

Goal: Be able to double-check the audio of your researched songs. How long is the song? What versions exist? What are the lyrics? What else is there to learn?

The most reliable source for these things is also the best source for any video versions of the song: YouTube.

So now you’ll find a new VIDEO button to the Song Detail screen.

clip_image002

When you push the new VIDEO button, we send an inquiry to the YouTube servers and receive back a special feed they have set up for video searches. We grab the (according to Google) best 5 matches to the song. Then, if I can find one of them with a copyright symbol in the notes, I promote that to first position, since it is the most likely to be an “official” video. Failing that, we look for the word “official” in the title. Of course, people do lie, so it isn’t perfect. Then, the other 4 video titles are loaded into a list. The second video is the one with the most views (unless the “official” and “most viewed” are the same). Then the others are listed below.

clip_image004

As you scroll through the list of videos, the comments for each are displayed to the right. Often, you’ll find lyrics or production notes about the video. In some cases this is pretty interesting stuff.

clip_image006

The first video is automatically launched. You can maximize the window, put the video into full screen mode, or increase the video quality to HD. I could have made HD automatic, but a lot of Internet connections are just too slow.

Obviously, this is a very quick way to experience the song’s audio and refresh your memory. It is also fascinating, sometimes, to learn about special intros done only for the video, or alternate versions, or high quality live performances. For special programming these might be useful in some cases. It could be interesting if once, and only once in a several month period, the station aired a live version of a Madonna hit from a Paris concert rather than the standard version. Just a little treat for the true fans.

MusicVISTA has long provided music test analysis that defines the cutting edge. Now we’ve added another in a growing set of tools that make implementing your AMT as easy and precise as possible.

Much more to come!

Tuesday, August 17, 2010

Core Artists

View and Share Who They Are and Basic Bio Information with Your Air Staff

Who are the artists that matter most to your listeners?

MusicVISTA has for some time included a display of an artist’s biographical profile from Wikipedia. It is displayed whenever you double-click on a song title to view all the research detail for that song.

This is a nice tool, and we’ve made it nicer!

Clean display

Most of the artist information we work with is from Wikipedia. It contains the kind of basic information that every on-air talent should have about an artist or band. But as you know, Wikipedia clutters up their display with a lot of extra information. Much of it is distracting.

So MusicVISTA now senses Wikipedia-based information and attempts to clean it up as much as possible.

Full page display with printing

Because the bio information is shared with the song results detail, you can’t see very much without scrolling. So we fixed that. Now there is a button that will display a Full Artist Page:

Click the button, and you get a full screen browser window with all the cleaned up biographical information.

You can click a PRINT button to get a print preview of your document. This tool comes with options. You can:

  • Alter your type size if you like. Shrink it and save pages, or enlarge it for easier reading in a dimly lit studio.
  • Hide or display headers and footers.
  • Change the margins.
  • Print all or only selected parts of the artist information.

Alternate biography sources

About 25% of artists don’t have English language Wikipedia entries. When they don’t, we try first to locate a Wikipedia entry in their home country. Then, we look, in this order, for a MySpace Music page, an iLike/Facebook page, an official site, or a Last.FM entry.

In truth, the most important and established artists almost always have Wikipedia entries and MySpace Music pages.

After a music test, identify and share information about your key artists.

MusicVISTA makes this easy. Here is what I suggest:

  • Identify the artists you think are key to your listeners. Make a list of 30.Or whatever number you are comfortable with.
  • Find and print out the Wikipedia biographies of each.
  • Packet these documents together and give a copy to each of your air talent.
  • Why not also give a copy to your station’s sales staff, so they better understand what your station is about?

Benefits:

By identifying this set of artists, you have communicated in a powerful way where the focus of the station is.

If they take even a few minutes, your air talent will be able to refresh their memories about the set of important entertainers that their own air shifts revolve around.

You will all recapture some of the excitement your own listeners feel about these musicians.

Focus. Clarity. Passion.

You don’t have a recent MusicVISTA AMT? Not a problem. Do this exercise anyway. Do it manually. It is a great exercise. If you have no research at all, then you will still be able to communicate to your air staff which artists best represent your personal vision for the station.

Friday, August 06, 2010

Category Rotations Worksheet Added to MusicVISTA


MusicVISTA will now give you the ability to calculate and optimize your category rotations as you review your music test results.

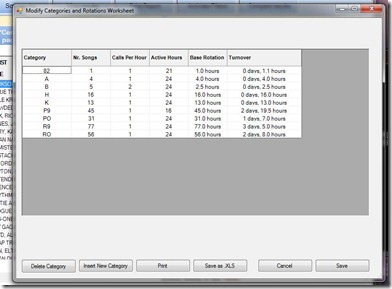
I have just expanded the menu option that allows you to add or change the category names. Now, we pull up the category names in a spreadsheet rather than a simple list. You’ll see a live update of the number of songs in a second column.

clip_image002

The next two columns are the Calls Per Hour for this category and the Active Hours for each category. This may be less than 24 if, for example, you have kept a category from playing in morning drive. These are editable. Just double-click a cell to put it in edit mode. Then, if you press SAVE your changes are made permanent.

The Base Rotation and Turnover (which compensates for active hours) columns are updated whenever a cell is modified. You can even change the number of songs in the category just to see the effect, although that won’t be saved; the true number will again appear the next time you view this dialog.

Because it is still the tool for working with category names as well as a rotation worksheet, I added the Delete Category button and Insert New Category buttons.

I also included a Print function and the ability to save this as an Excel .XLS page.

MusicVISTA has long provided music test analysis that defines the cutting edge. And now we’ve added one more in a growing set of tool to make your task of implementing the AMT as easy and precise as possible.

Much more to come!

Tuesday, June 01, 2010

iPad to Improve your Station Web Site

Something Jerry Del Colliano wrote makes sense: Optimize your station website for the iPad.

Only a small percentage of visitors to your site will use iPads. But in making the experience more enjoyable for them, you’ll make design and content improvements for everybody.

I believe that this makes you think about how people on a powerful mobile device might best enjoy and benefit from your site. Because the screen is a bit smaller than the average laptop, it should also encourage you to look at how to remove clutter.

Is it practical to ask your web design people: Think about how our site would be done if it were to look fantastic on an iPad. Can you show us a mock-up?

Another good question for the people who work with you to stream audio: What would it take to make the audio streaming iPad-compatible?

Tuesday, April 27, 2010

This App Just Works

Trying to find an app for listening to stations’ live audio feeds has been frustrating for me – until now.

I’ve tried and rejected a number of programs.

Then I came across an app for the iPhone and iPad called "Pocket Tunes”.

$5.00 was the most recent price I saw.

I’m running it on my iPad. So far, it handles every single station I’ve thrown it. That means it is supporting a large number of audio formats, including Windows media.

Nothing too fancy. It just works. Highly recommended.

Saturday, April 17, 2010

AMT Hook Titles: Mix Them Up

I’m running into more and more programmers who are not working very hard on the presentation order of the songs in their AMT.

Some simple rules:

Songs should be randomized.

When you think of songs to test there is a natural bias toward better songs at the beginning. You run out of good songs as you select more songs to test. Eliminate this problem by shuffling the songs.

Two songs by the same artist should not come up near each other. Manually adjust the song order as needed to separate them by 5 or most songs.

Do not play the songs in alphabetical order by title. Some listeners will notice and focus on that. You want them focused on something else.

One more note, only slightly off topic. Find 3 songs to use as examples at the very beginning of the AMT, when you are explaining how it works. Those particular songs should be strong, so the people feel comfortable that, yes, this is their kind of music. Don’t count these opinions.

You can include these songs again later in the AMT, for a more accurate measurement.

Last minute addition: Don’t put the songs in any other discoverable order. For example, oldest songs to newest. No patterns at all.

Friday, April 16, 2010

The decision isn’t always made now

This is an irritating problem with the PPM methodology. Specifically, it means that we can’t learn very much by looking at the minute by minute information.

Many decisions about the relationship with the station are made later. They are based on accumulated experience. They are affected by trust or the lack of it.

How many things are an acquired taste? Wildly popular! But with success that is achieved only after a difficult period which must be overcome by the passage of time. More people discover that the “story” holds up as interesting, once they know a little more.

Is it possible to build a morning show without a period of discomfort on the part of existing listeners, only balanced by the passage of enough time for others to discover the compelling stories told? And isn’t it true that stations used to work much harder to hasten that, with huge marketing efforts to help increase the comfort level of listeners with a new morning show?

Often, the action being recorded isn’t a “decision” at all. It is audio exposure, yes, but did somebody really choose to listen?

When the the listener leaves the station, was it based on the programming? Or did somebody else need to talk to them, so they shut the radio off? Did they arrive at their destination?

Remember – we don’t know.